Why Python needs to be paused during profiling - but Ruby doesn't always
One of the cool things about the rbspy profiler is that it
can profile any running Ruby program, without even pausing the Ruby program that is being profiled. Rbspy is a sampling profiler, and
when the --nonblocking argument is passed to it, it will collect each stack trace from the
profiled program without pausing it or doing any synchronization. This has the advantage of not slowing down the
profiled program at all, but has the disadvantage of leading to a data race between the rbspy
profiler and the Ruby program being profiled. In the nonblocking mode, rbspy tries to get an accurate stack
trace from the Ruby program while the Ruby program is actively changing the stack by running the
code - and since there is no locking happening there is potential
for a data race. Amazingly, rbspy still manages to get good results even without doing any
synchronization.
Julia Evans wrote an excellent post about whether to pause Ruby during profiling - and concluded that pausing the Ruby program wasn’t always necessary. While running in the nonblocking mode can cause some minor errors and isn’t the default anymore, the profiles generated in the nonblocking mode are still fairly accurate.
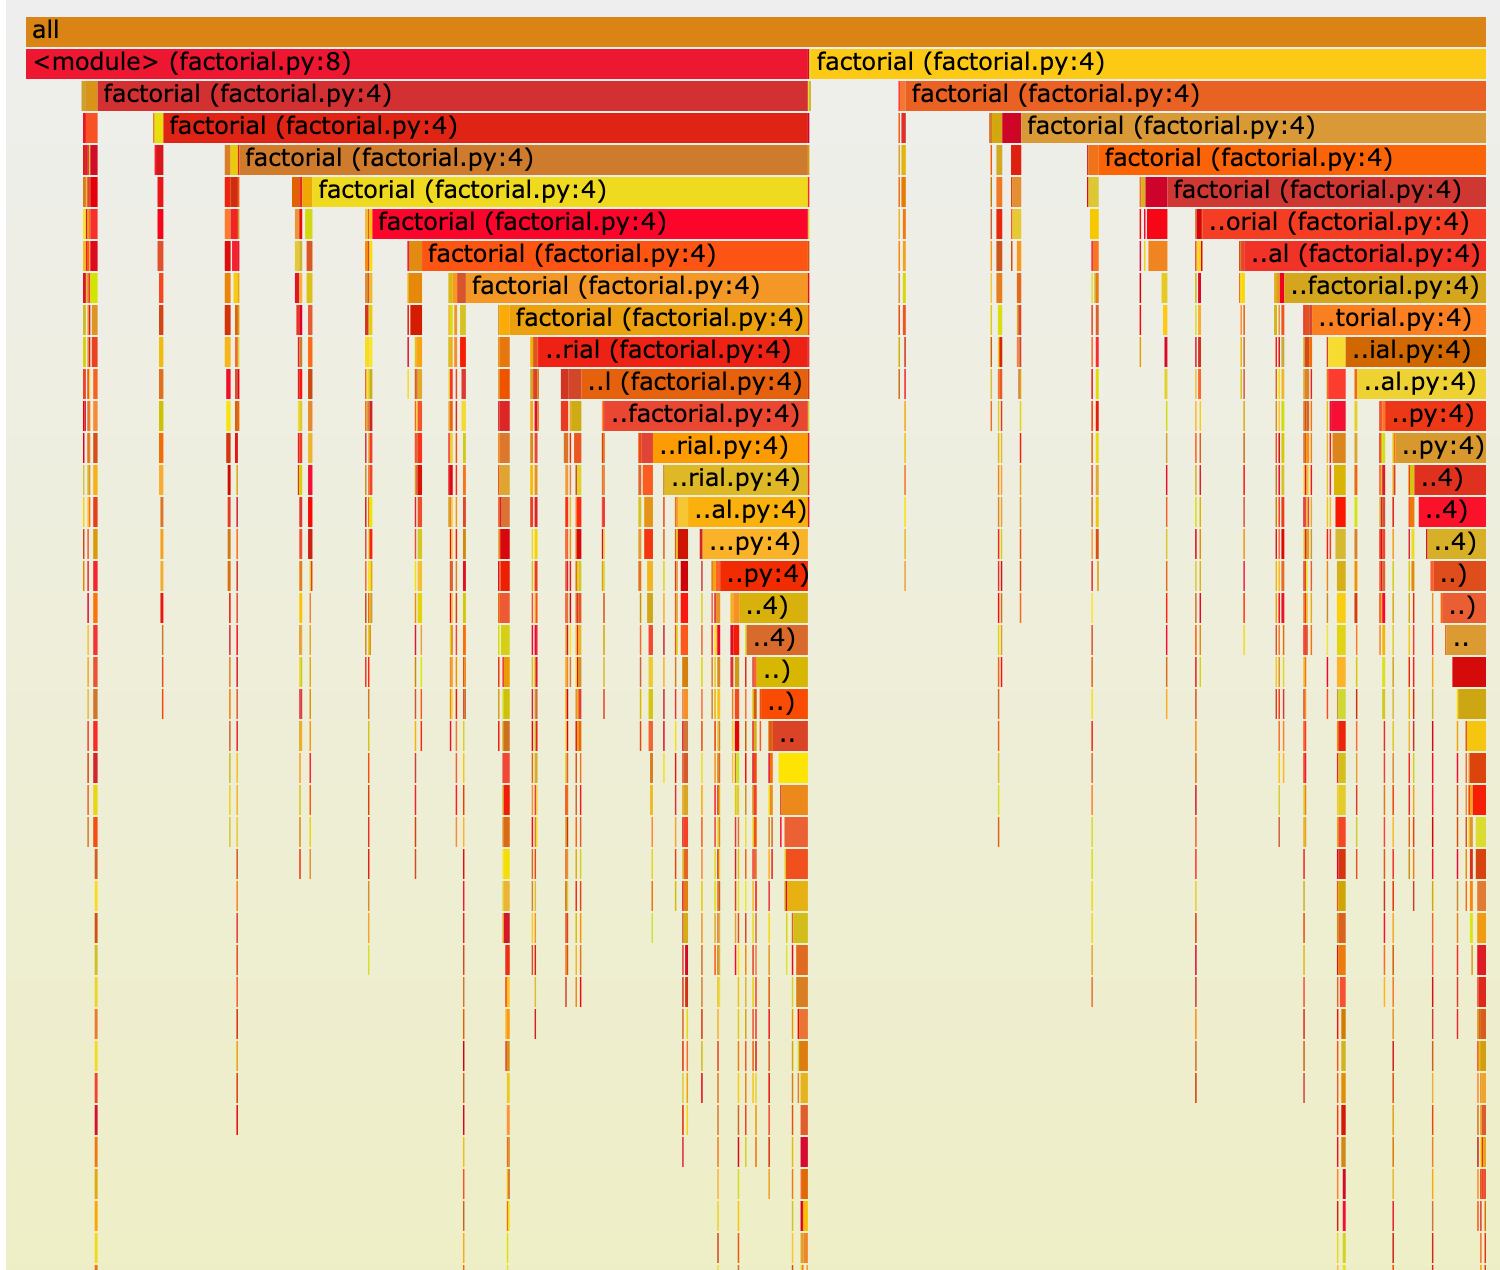
This isn’t the case with py-spy, which is a similar sampling profiler for Python programs. When you run py-spy in the nonblocking mode, the profiles generated can be wildly misleading and nonsensical.
This post is talking about what the effects of a data race look like when profiling with py-spy, why this happens with py-spy much more frequently than in rbspy due to differences in the CPython and CRuby interpreter implementations, and why you still might want to consider using the nonblocking in some conditions despite the potential for inaccurate profiles being generated.
Profiling Native Python Extensions
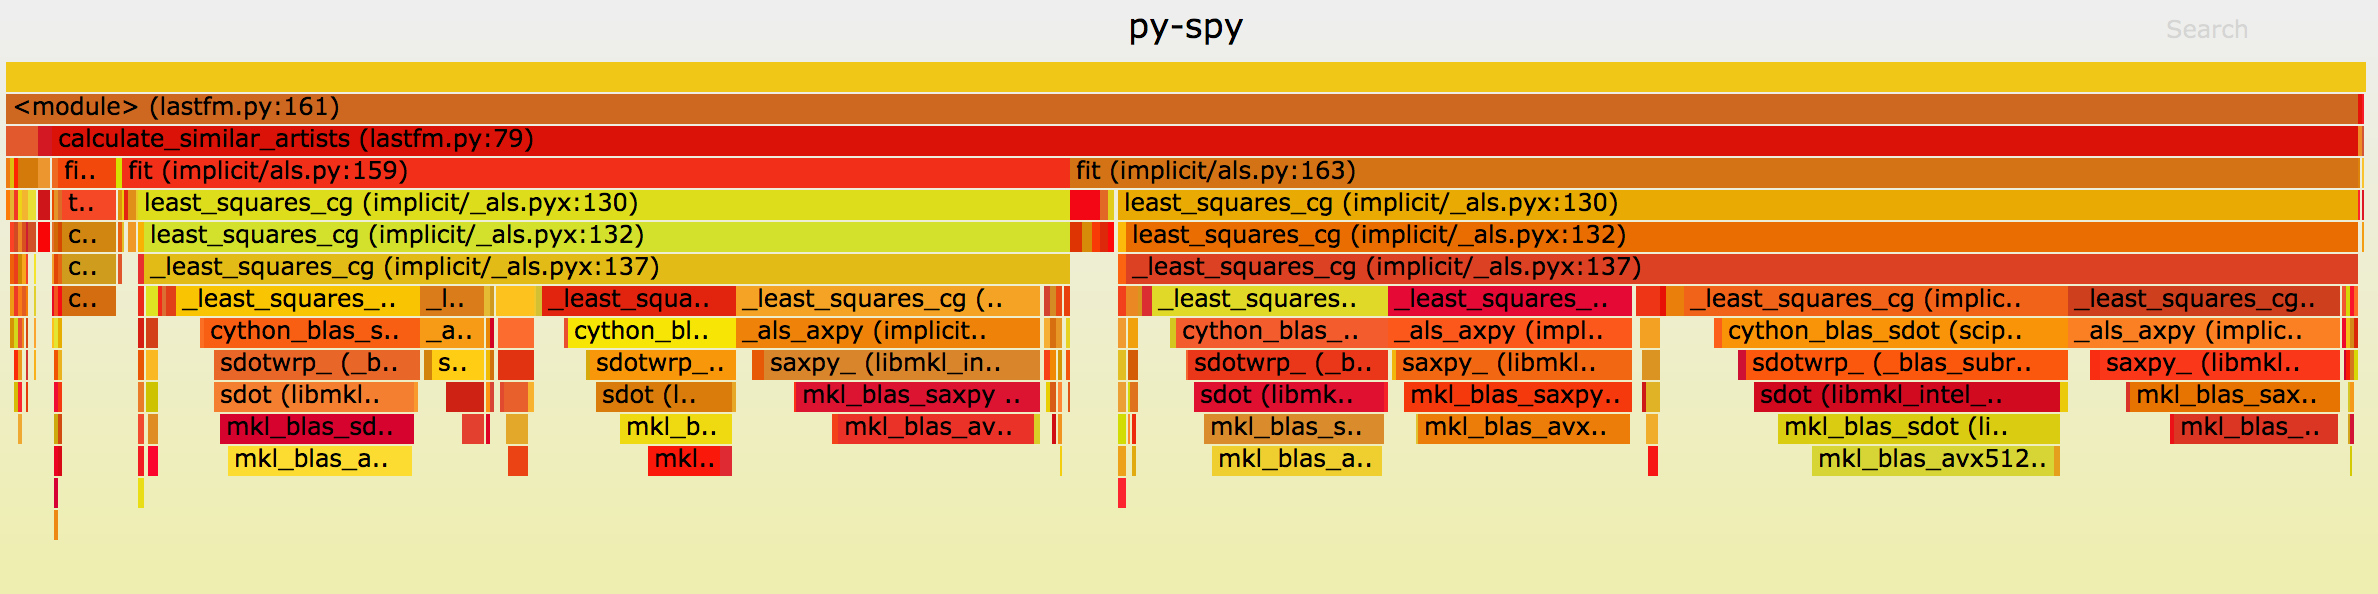
One of the cool new features in py-spy is the ability to profile native Python extensions written in languages like C, C++ or Cython.
Almost all other Python profilers[1] only show program activity that is in pure Python code, and native code will instead show up as spending time in the line of Python that calls the native function. Using native profiling tools like perf can get you a sense of what’s going on the native side of things but at the expense of losing any visibility into what’s happening with the Python function calls.
The big problem with this is that a huge amount of the Python ecosystem is in native extensions. It’s a common optimization pattern to rewrite the slowest part of your Python program in a language like Cython or C++ after profiling, and by only being able to profile either the native code or the python code you only get half the picture of what’s happening in your python codebase.
Writing Python Extensions In Rust Using PyO3

I’ve been writing some code in Rust recently, and I thought it would be cool if I could take some of this Rust code and provide it as a native extension that I can call from Python. It turns out there are some amazing tools like PyO3 that make it easy to write fully featured Python extensions in Rust, with considerably less effort than writing a CPython extension manually.
To test out PyO3 I wrote a small Python extension in Rust, and I thought I would share some of the tips and tricks I encountered in getting this going. This post aims to serve as a quick tutorial showing how to write extensions in Rust, talking about why you might want to use something more powerful than just exposing a C library called using CFFI, and how PyO3 lets you write Python aware extensions in Rust. This post also goes through how to integrate your Rust code with setuptools, and automatically building Python wheels for your Rust extension using cibuildwheel.
The end result is a Python extension that can be distributed through PyPI without even usually requiring a rust compiler on the machine it will be installed on!
Where Do The World's Software Developers Live?
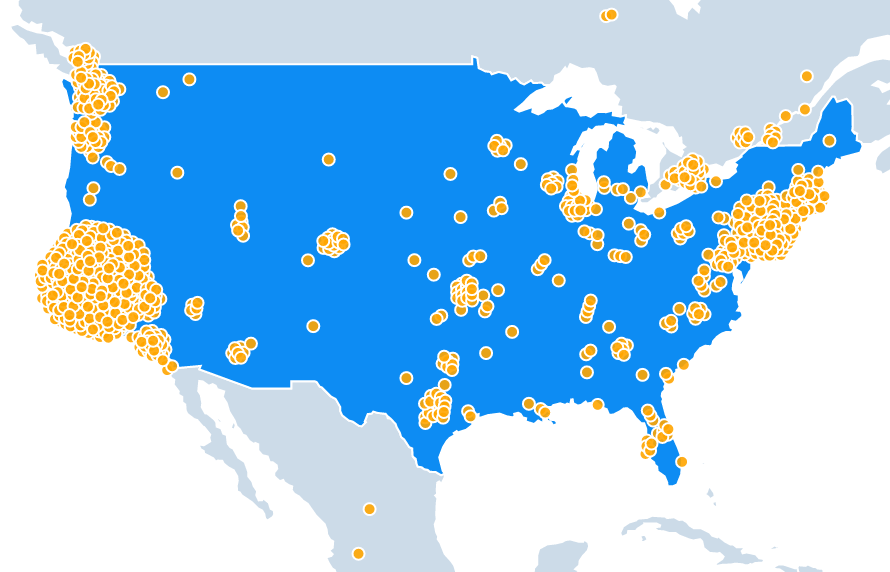
I’ve been digging into GitHub data recently, and I thought it would be fun to use that data to figure out exactly where the world’s software developers live and then to visualize the results interactively using D3.
In a previous post, I wrote about how an individual’s GitHub profile is a noisy and unreliable indicator of programming talent. For this post though I’m aggregating GitHub profiles together over the population of an entire country or city, meaning that the impact of the data sparsity and noise issues I was talking about shouldn’t be nearly as significant.
The results ended up being pretty interesting. While top developers live all over the world, an extraordinary amount of them seem to live in the San Francisco Bay area. Likewise, it seems that developing open source software is a luxury for the rich, India has an unusual lack of famous developers, and Eastern Europe might offer the best value on hiring remotely.
Generating Flowers Using Simplex Noise

I’m working on a larger generative art project, and one thing that I need for this is an abstract representation of something that could conceivably be eaten by an ant. While ants will apparently eat almost anything, I decided to use flowers to represent their food since pictures of decomposing fruit didn’t end up looking all that appealing.
This post is a quick tutorial on how I generated these flowers using simplex noise. The code to generate this ended up being just a couple of lines of Typescript, and a whole range of different abstract flowers can be generated by changing just a few parameters. I’ve included the code below along with an interactive visualization to explain how this all works.
Why GitHub Won't Help You With Hiring
One of the things I’m working on right now is a project that’s aggregating data found in developers GitHub profiles. Since there are a couple of problems with using GitHub profiles as a data source like this, I wanted to first list out some of the issues I have with trying to assess developers by looking only at their GitHub contributions.
One common misuse of GitHub profile data is in trying to filter out job candidates. People still seem to think that you can figure out how talented a developer is merely by looking at their open source contributions. As an example in the latest Hacker News’ Who is Hiring thread, there are a bunch of different job ads asking for a Github profile as part of the job application.
There are already a bunch of great posts arguing against requiring GitHub contributions as part of the hiring process. I particularly recommend The Ethics of Unpaid Labor and the OSS Community and Why GitHub is Not Your CV. While both of those posts give excellent reasons to reconsider asking for open source contributions when hiring, my take here isn’t about why it is ethically dubious to require open source contributions or why GitHub isn’t great for showcasing your projects.
Instead, this post is about why GitHub profiles just aren’t all that useful when looking to hire developers.
Ranking Programming Languages by GitHub Users
I’ve recently become obsessed with the sheer amount of development activity happening on sites like GitHub.
As a first project on working with this data, I thought it would be fun to rank all the programming languages by counting how many people on GitHub use each language.
I’m using the GitHub Archive and GHTorrent projects as data sources for this analysis. The GitHub Archive provides a record of every public event on GitHub since early 2011. This includes an event every time someone has pushed new code, forked or starred a repository, or opened an issue on GitHub. Overall the GitHub Archive has more than 1.25 Billion events on more than 75 Million different repositories. GHTorrent goes even further and hits the GitHub API for each event - which lets me resolve the language for most repositories.
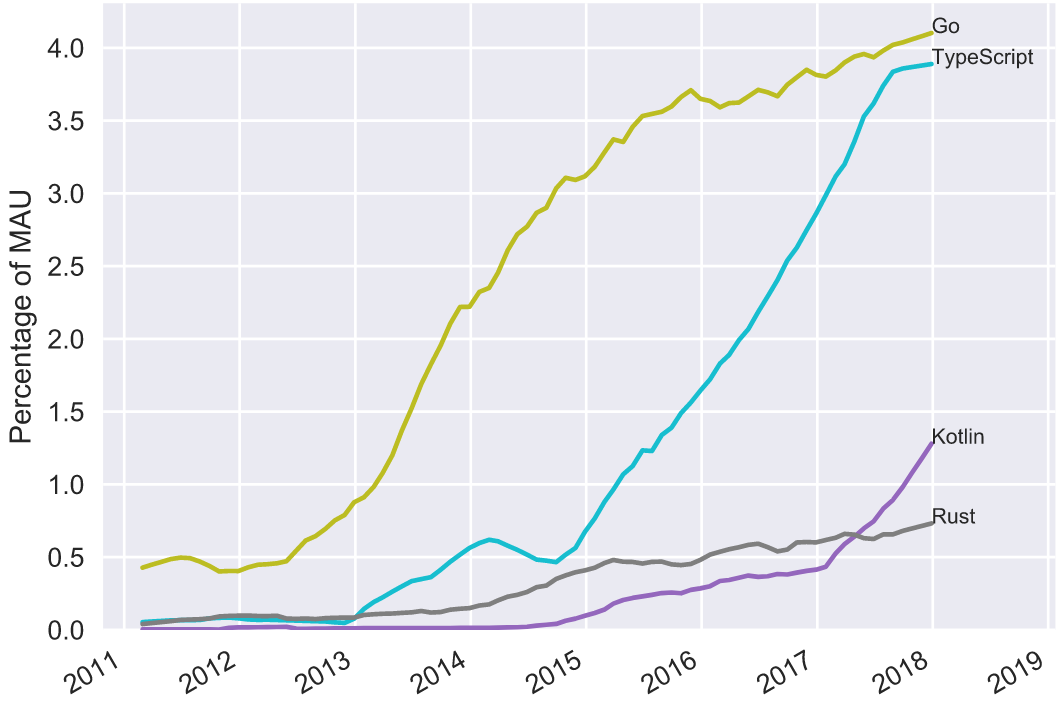
The cool thing about this is that there are usernames associated with each of those events, which means that I can count how many different people are using each language. Every time a user interacts with a repository I’m counting that user as using the language of that repository - and then aggregating this each month to calculate how many Monthly Active Users (MAU) each language has.
Since the data goes back 7 years, I can also plot how popular each programming language was over time which reveals some interesting patterns. Looking at these trend lines, we can figure out which programming languages are worth learning, and which programming languages probably should be avoided.
CUDA Tutorial: Implicit Matrix Factorization on the GPU
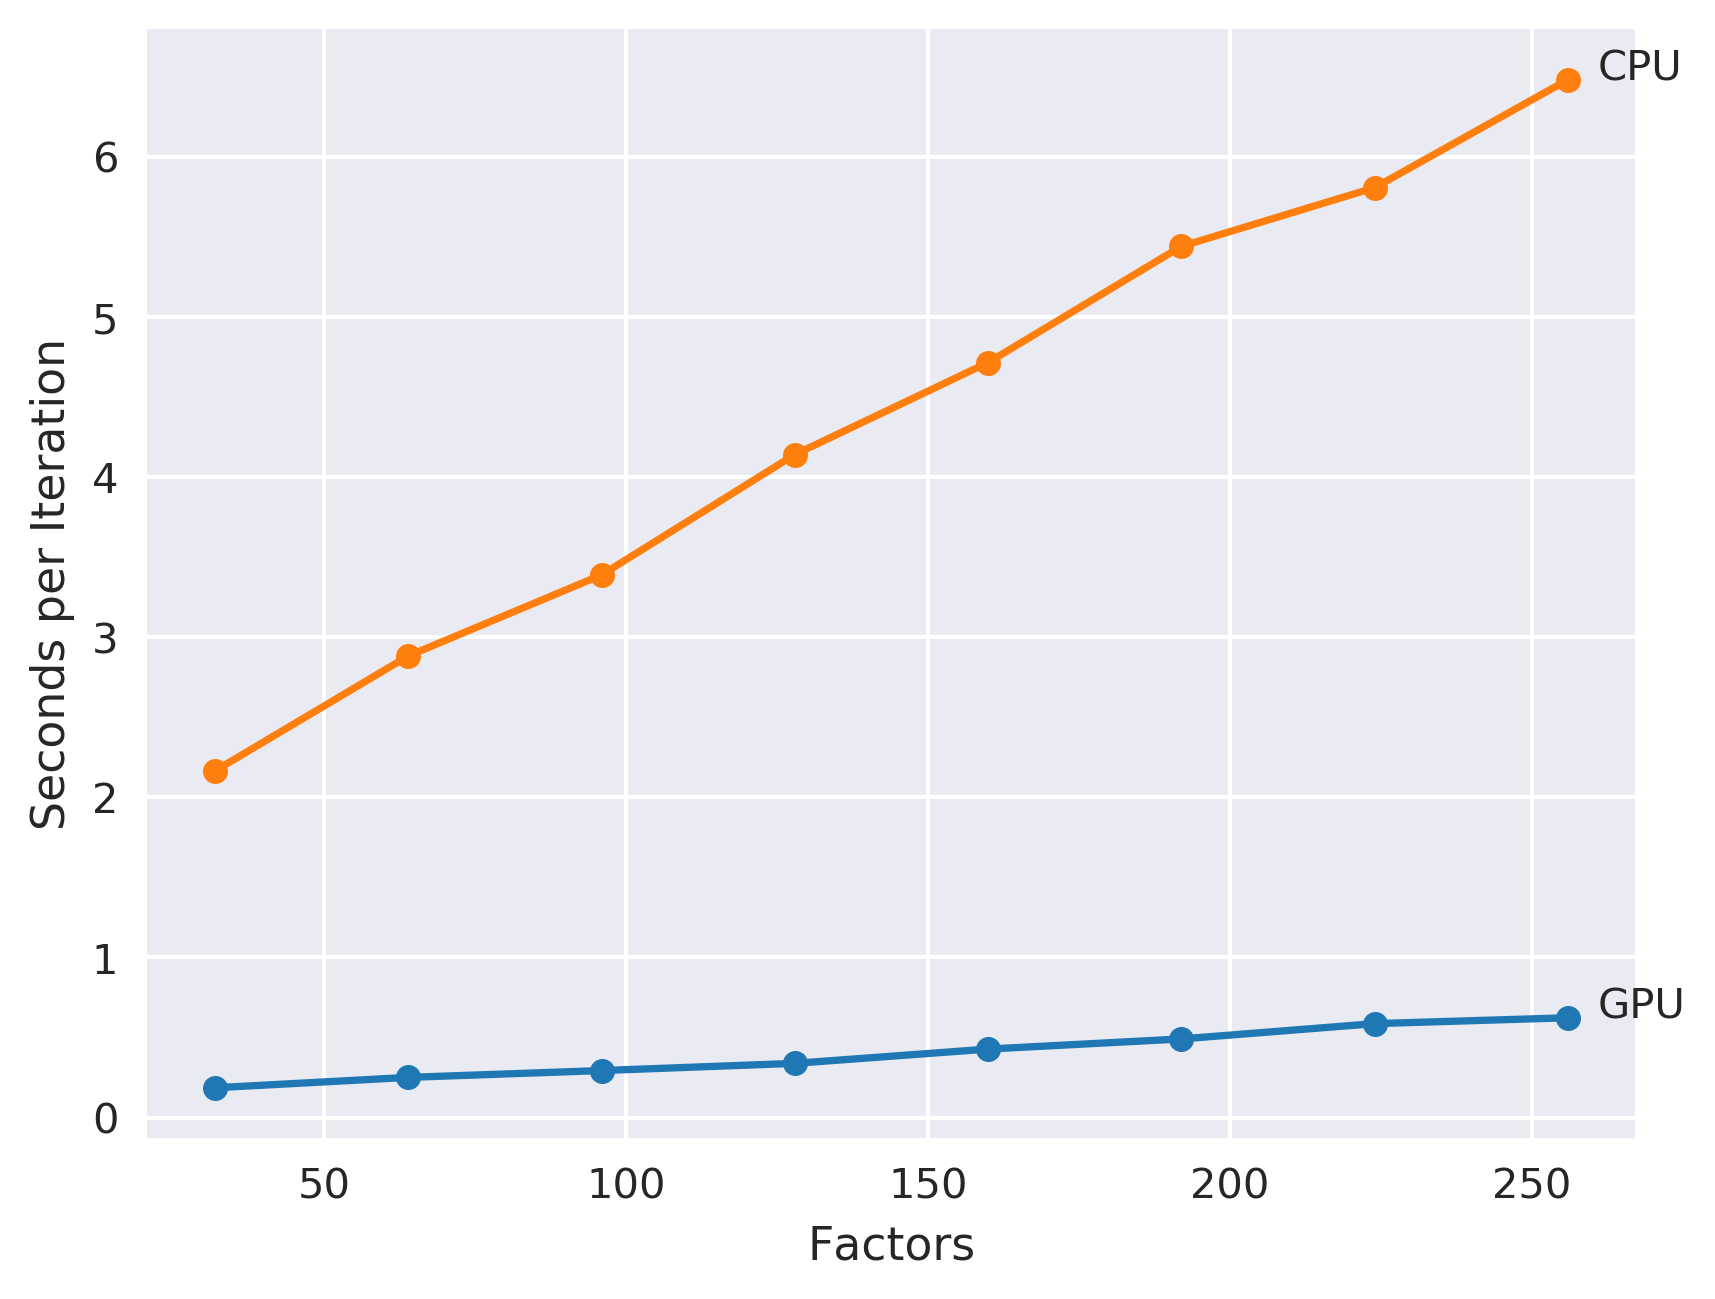
I recently bought a system that actually has a decent GPU on it, and I thought it would be cool to learn a little bit about CUDA programming to really take advantage of it.
The obvious choice of problems to get started with was extending my implicit matrix factorization code to run on the GPU. I’ve written a couple of posts about this recommendation algorithm already, but the task is basically to learn a weighted regularized matrix factorization given a set of positive only implicit user feedback. The nice thing about this model is that it is relatively simple while still not being possible to express efficiently on higher level frameworks like TensorFlow or PyTorch. It’s also inherently embarrassingly parallel and well suited for running on the GPU.
This post aims to serve as a really basic tutorial on how to write code for the GPU using the CUDA toolkit. I found that CUDA programming was pretty interesting, but it took me a little bit to learn how to do this effectively - and I wanted to share what I learned while it is still fresh in my mind.
An Analysis of the World's Leading robots.txt Files

A site’s robots.txt file advises the web crawlers of the worlds what files they can and can’t download. It acts as the first gatekeeper of the internet, unlike blocking the response - it lets you stop requests to your site before it happens. The interesting thing about these files is that it lays out how webmasters intend automated processes should access their websites. While it’s easy for a bot to just ignore this file, it specifies an idealized behaviour of how they should act.
As such these files are kind of important. So I thought I’d download the robots.txt file from each of the top million websites on the planet and see what kind of patterns I could find.
I got the list of the top 1 million sites from Alexa and wrote a small program to download the robots.txt file from each domain. With the data all downloaded, I ran each file through pythons urllib.robotparser package and started looking at the results.
Approximate Nearest Neighbours for Recommender Systems
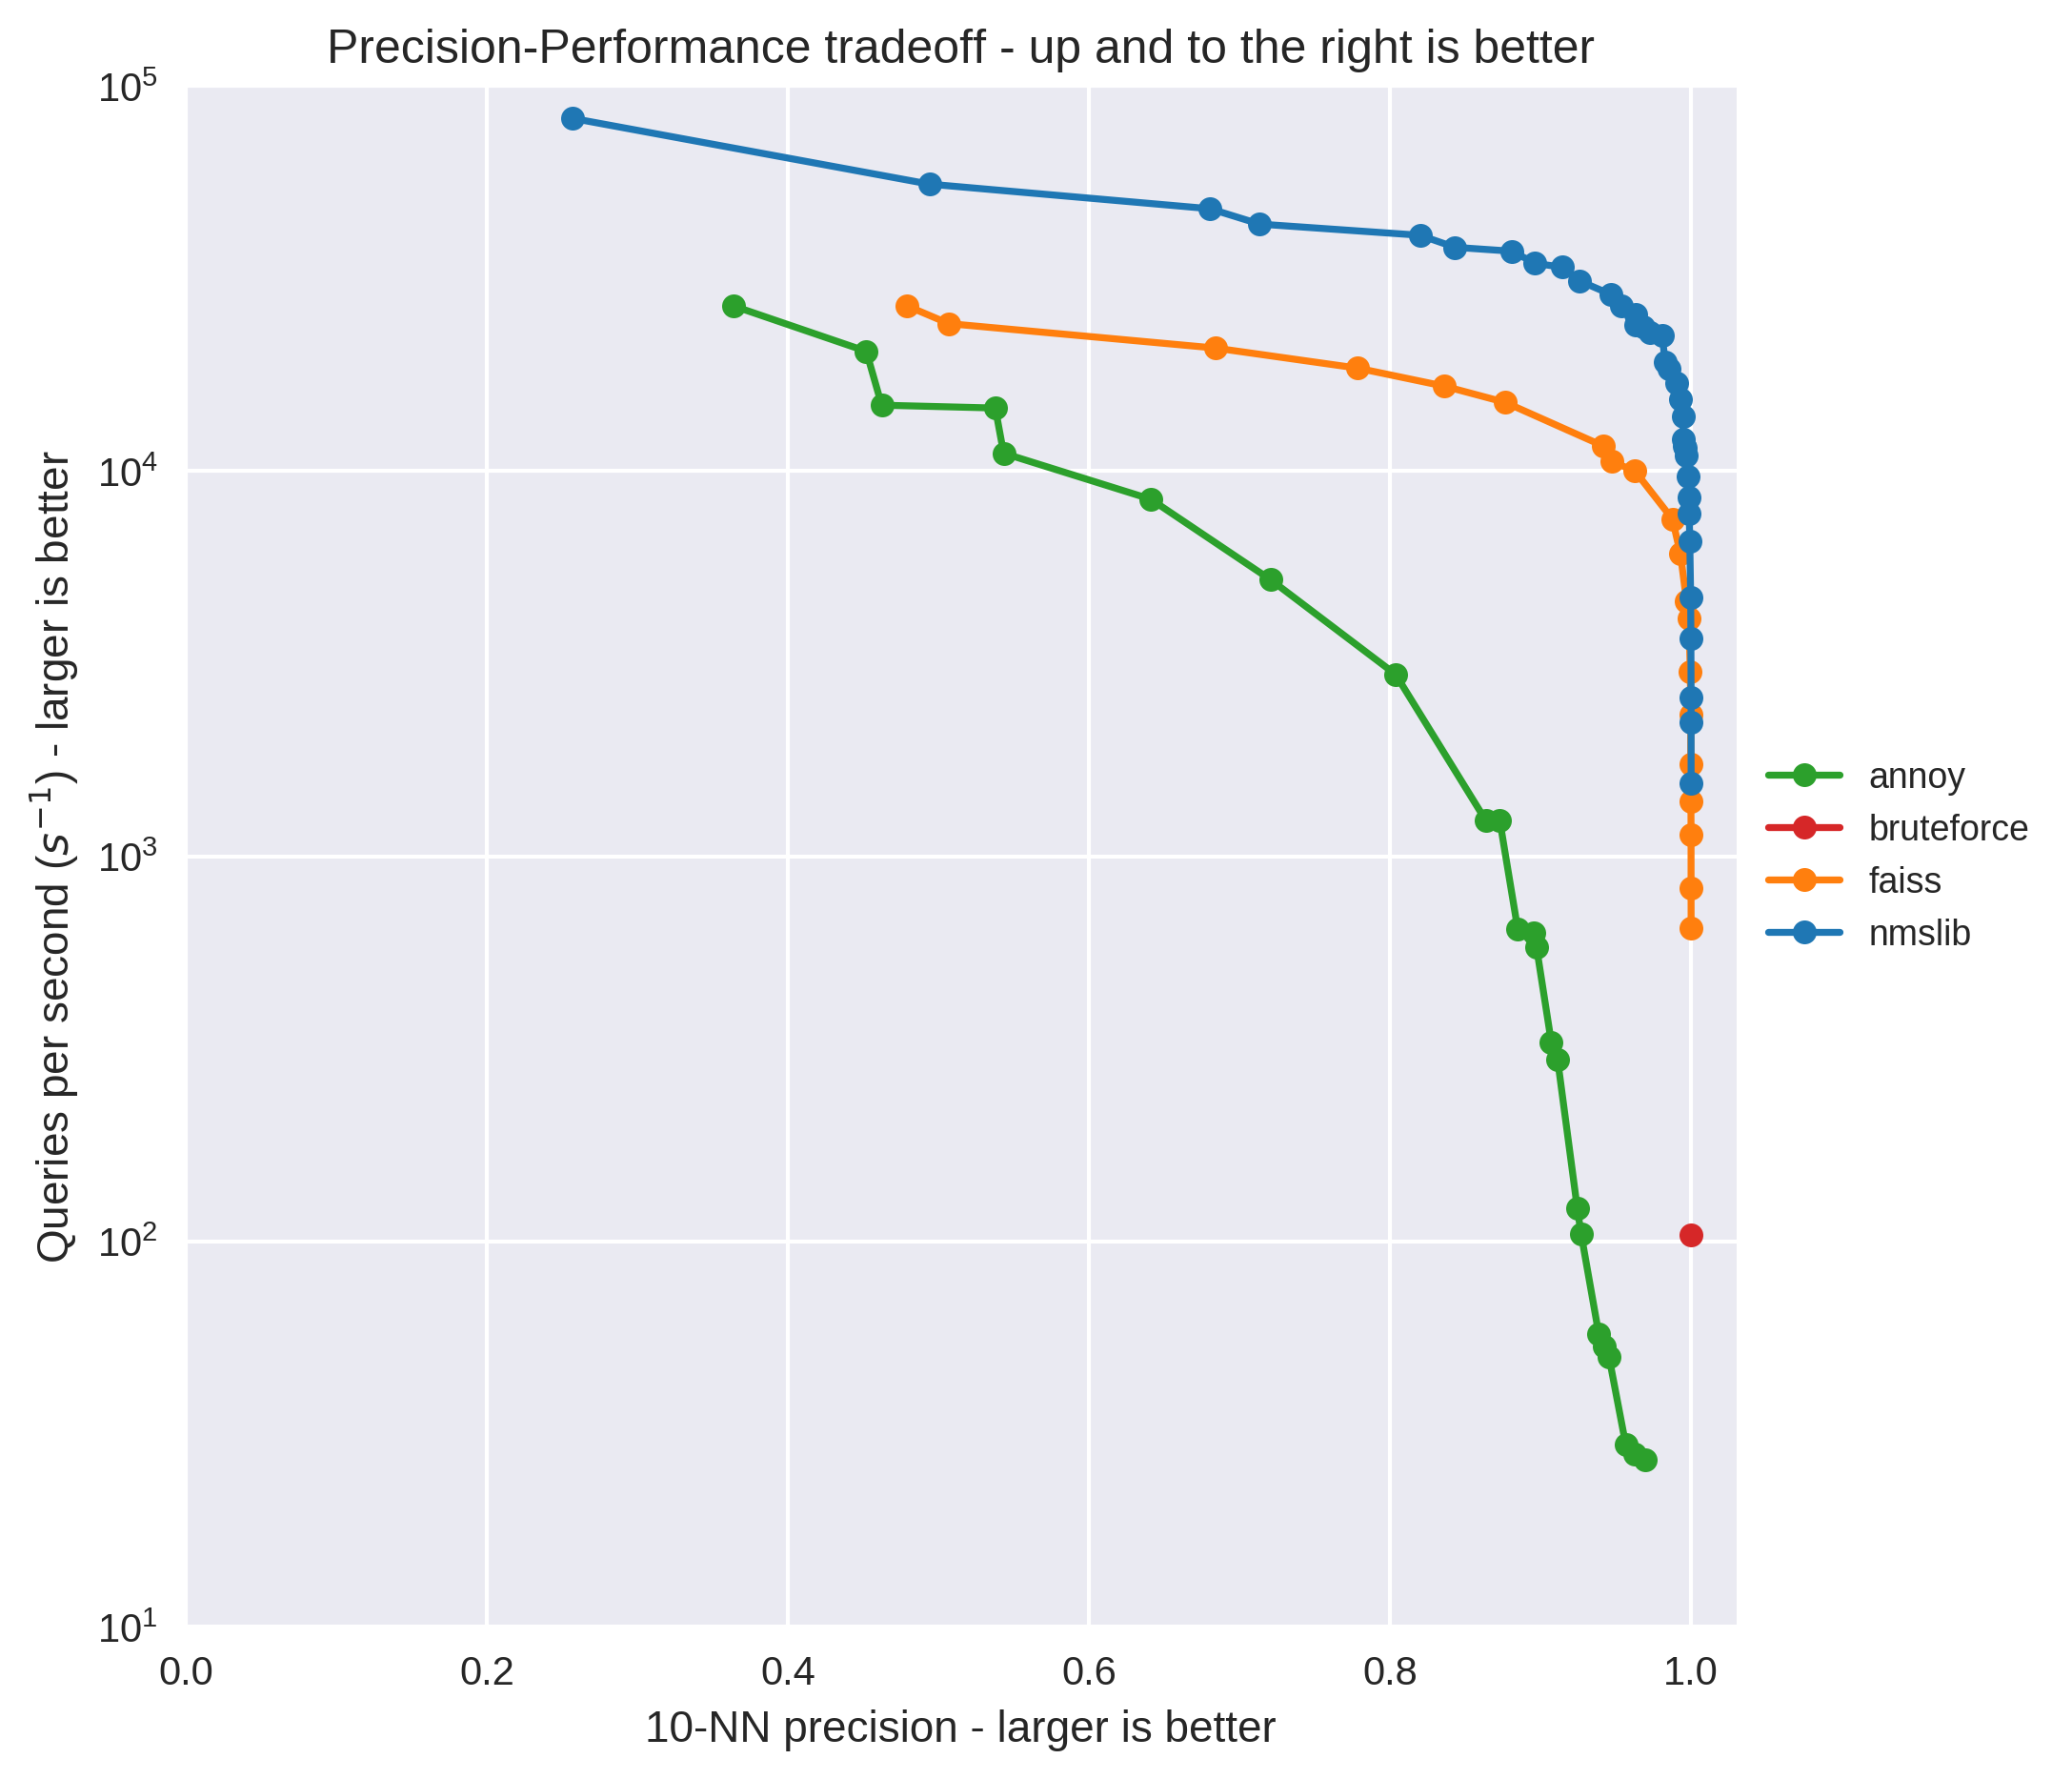
One challenge that recommender systems face is in quickly generating a list of the best recommendations to show for the user. These days many libraries can quickly train models that can handle millions of users and millions of items, but the naive solution for evaluating these models involves ranking every single item for every single user which can be extremely expensive. As an example, my implicit recommendation library can train a model on the last.fm dataset in 24 seconds on my desktop - but takes over an hour to use that model to generate recommendations for each user.
This post is about evaluating a couple of different approximate nearest neighbours libraries to speed up making recommendations made by matrix factorization models. In particular, the libraries I’m looking at are Annoy, NMSLib and Faiss.
I’ve used Annoy successfully for a couple different projects now in the past - but was recently intrigued when I read that NMSLib can be up to 10x faster when using its Hierarchical Navigable Small World Graph (HNSW) index option. I also wanted to try out Faiss after reading the blog post that Facebook Research wrote about it - where they claimed that the GPU enabled version of Faiss was the fastest available option.
Both NMSLib and Faiss turn out to be extremely good at this task, and I’ve added code to implicit to use these libraries for generating recommendations.
Python as a Declarative Programming Language
If you look at the programming languages benchmarks game, Python is one of the slowest commonly used programming languages out there. Typical programs written in pure Python average around 40 times slower than the equivalent program written in C or C++.
Despite the performance penalty, Python is still probably the most popular language choice out there for doing Data Analysis and Machine Learning. Most of the recent Deep Learning frameworks target Python for development: TensorFlow, Theano, and Keras all use Python. Torch originally was written for Lua, which is substantially faster than Python when using LuaJIT - but Torch failed to gain traction until switching to Python with the release of PyTorch.
The reason for this is that the performance penalty in writing programs in Python isn’t as large as the programming language benchmarks game would suggest: Most of the best Python Data libraries have their core routines written as native extensions.
This all means that to get the most out of these libraries, you need to treat Python as a Declarative Language - and push as much control flow as possible down to a native layer, and just let the Python program describe what needs done.
Faster Implicit Matrix Factorization
As part of my post on matrix factorization, I released a fast Python version of the Implicit Alternating Least Squares matrix factorization algorithm that is frequently used to recommend items. While this matrix factorization code was already extremely fast, it still wasn’t implementing the fastest algorithm I know about for doing this matrix factorization.
This post is just a quick follow up, talking about why this algorithm is important, where the common solution is slow and how to massively speed up training using a paper based on using the Conjugate Gradient method.
An Interactive Tutorial on Numerical Optimization

Numerical Optimization is one of the central techniques in Machine Learning. For many problems it is hard to figure out the best solution directly, but it is relatively easy to set up a loss function that measures how good a solution is - and then minimize the parameters of that function to find the solution.
I ended up writing a bunch of numerical optimization routines back when I was first trying to learn javascript. Since I had all this code lying around anyway, I thought that it might be fun to provide some interactive visualizations of how these algorithms work.
The cool thing about this post is that the code is all running in the browser, meaning you can interactively set hyper-parameters for each algorithm, change the initial location, and change what function is being called to get a better sense of how these algorithms work.
All the code for this post is up on github if you want to check it out, it has both the minimization functions as well as all of the visualizations.
Finding Similar Music using Matrix Factorization

In a previous post I wrote about how to build a ‘People Who Like This Also Like …’ feature for displaying lists of similar musicians. My goal was to show how simple Information Retrieval techniques can do a good job calculating lists of related artists. For instance, using BM25 distance on The Beatles shows the most similar artists being John Lennon and Paul McCartney.
One interesting technique I didn’t cover was using Matrix Factorization methods to reduce the dimensionality of the data before calculating the related artists. This kind of analysis can generate matches that are impossible to find with the techniques in my original post.
This post is a step by step guide on how to calculate related artists using a couple of different matrix factorization algorithms. The code is written in Python using Pandas and SciPy to do the calculations and D3.js to interactively visualize the results.
As part of writing this post, I also open sourced a high performance python version of the Implicit Alternating Least Squares matrix factorization algorithm. Most of the code here can be found in the examples directory of that project.
A Better Algorithm for Area Proportional Venn and Euler Diagrams
A while ago I wrote a small library for displaying Venn and Euler diagrams when trying to learn Javascript.
By specifying the sizes of each area in the diagram, the library automatically draws a Venn or Euler diagram such that areas displayed have sizes that approximately match the input.
Sample output of this library, from this tumblr
It turned out that displaying the circles is trivial - but calculating the positions of the circles such that the diagram is area proportional is a surprisingly tricky numerical optimization problem.
The original solution I came up with worked fairly well, but there were a couple of minor cases that it broke down on. Since people kept on starring this library on GitHub, I thought I would do them all the favour of fixing these errors by implementing an idea I had for a new layout algorithm.
I tested this new algorithm, and found that it works exceedingly well. In fact it far surpasses the best published academic research on laying out area proportional Venn and Euler diagrams. I’ve included some interactive graphs showing the performance on this benchmark here, as well as a visualization of how this algorithm works.
Unicode is Kind of Insane
 U+1F4A9 'Pile Of Poo'
Unicode is one of the greatest standards of the modern age, but its simple appearance hides an insane level of complexity.
Unicode aims to represent every possible character in every possible language in a single character encoding. It’s an ambitious undertaking, the current version has mapped 113 thousand distinct characters to code points in Unicode - each one of which is given a unique name and description.
Basically every language ever written can be encoded with Unicode now. Even dead languages like Phoenician, Aramaic and the Ancient Greek ‘Linear A’ script all have code points assigned. Linear A hasn’t even been deciphered yet, so there are characters in Unicode that no-one knows what they actually represent!
Likewise Unicode contains a huge assortment of symbols that aren’t part of any language. Emoji like a Christmas Tree, a Slice of Pizza, or a Pile of Poop all can be represented with a single Unicode code point.
However, the real craziness with Unicode isn’t in the sheer number of characters that have been assigned. The real fun starts when you look at how all these characters interact with one another.
Distance Metrics for Fun and Profit
A while ago a friend of mine asked me how I would go about building a ‘People Who Like This Also Like …’ feature for a music startup he was working at. For each band or musician, he wanted to display a list of other artists that people might also be interested in.
At the time, I think I arrogantly responded with something like “That’s easy! I can think of like a dozen ways of calculating this!”. Which of course was profoundly unhelpful and probably slightly infuriating. Once he calmed down, I sketched out how I would calculate the distance between any two artists - and use that distance as a ranking function to build this feature.
Since then he has been encouraging me to write a blog post about this, and after a totally unreasonable delay I finally got around to finishing it up. So here is my step by step guide for the non data scientist, using Python with Pandas and SciPy to compute the distances, and D3.js for building gratuitously interactive visualizations.
Don't Pickle Your Data
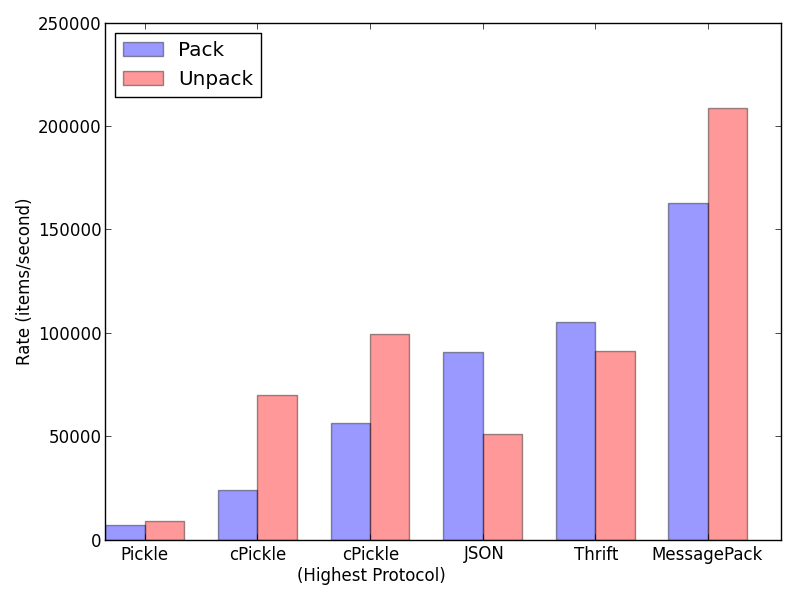
Pretty much every Python programmer out there has broken down at one point and and used the ‘pickle’ module for writing objects out to disk.
The advantage of using pickle is that it can serialize pretty much any Python object, without having to add any extra code. Its also smart in that in will only write out any single object once, making it effective to store recursive structures like graphs. For these reasons pickle is usually the default serialization mechanism in Python, used in modules likes python-memcached.
However, using pickle is still a terrible idea that should be avoided whenever possible.
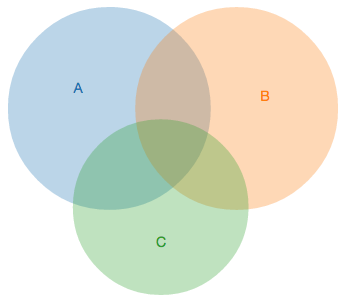
Calculating the intersection area of 3+ circles
While attempting to learn Javascript and D3.js a couple months ago, I wrote a little library for displaying area proportional venn diagrams.
One thing this library didn’t do though is consider the intersection areas of 3 or more circles when placing each set in the venn diagram. Its a trickier problem than I first thought, mainly because of all the special cases that can arise when the number of circles gets large. While the 2 circle case is a simple calculus problem, I failed to extend this solution to calculate the intersection area of an arbitrary number of circles.
The research papers I read on this both avoided calculating the circle intersection by using approximation techniques. One paper approximated the circles using polygons and used polygon intersection techniques to get the area, and the other approximated by plotting each circle and using binary indexing to compute the area. I tried out the latter approach, but found it to be too slow for realtime use.
Since then, I’ve had some ideas on different approaches to this problem that I wanted to try out. To keep up with learning D3, I also thought I’d try visualizing each approach here.
Visualizing min-heap algorithms with D3.js
I haven’t done any real work on learning Javascript and D3.js since my last attempt a couple months back. To keep at it, I thought I’d try using D3.js to visualize a simple algorithm: finding the largest couple of items in a list.
This problem comes up all the time when doing search and recommendation type tasks. Every time you query a search engine, it has to find the couple best scored results in all matching items. For example, Google finds 15 million results when querying for ‘D3.js’, but only shows you the 10 best scored of these. A naive solution for finding these 10 items would be to sort everything by score, but that ends up wasting a ton of time sorting results that will be discarded.
A better solution is to use a min-heap - a tree data structure where each node in the tree has a value smaller than all of its children. Its a fantastically useful data structure, that can be used to efficiently solve this problem. By comparing each item with the root element of an appropriately sized min-heap, and pushing onto the heap when its bigger - it picks out the just the largest items:
Why you can't dislike something on Facebook
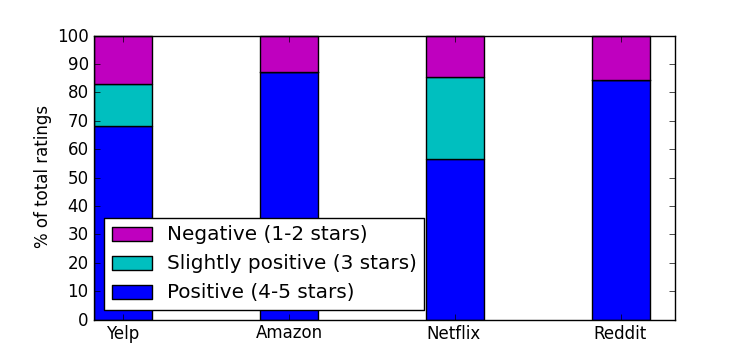
Ever wonder why Google+ and Facebook don’t let you dislike something? The Facebook like button and the Google +1 button are mostly ubiquitous around the web at this point, but they don’t provide the symmetric action for disliking or -1ing anything.
This is in sharp contrast to the rest of the ratings systems around the web, which mostly fall into two camps:
- 5-star ratings used by companies like Netflix, Amazon and Yelp
- Thumbs up/down style used by sites like Reddit, YouTube and of course at my own work, Zite
Google+ and Facebook are somewhat unique in that they only offer the ability to give positive feedback. Now part of that reason is undoubtedly that they don’t want people going around disliking pages from their advertisers that are the ones actually giving them money. However, I think the biggest reason is that even if they did offer a dislike button, people just wouldn’t use it often enough to justify the precious screen real estate it would take up.
Data Visualization using Multidimensional Scaling
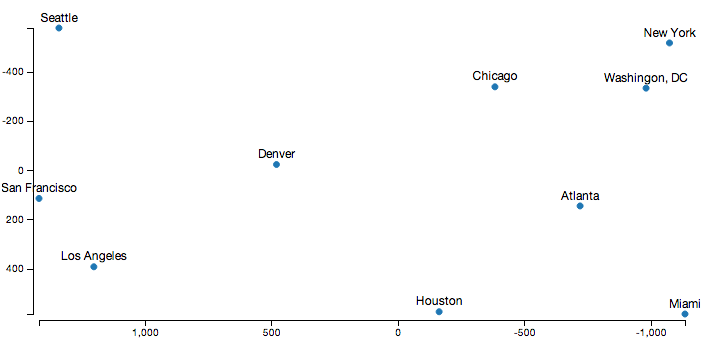
Say that one day you’re faced with a table of distance information between a bunch of points. Just looking at the table doesn’t really provide any real information about the underlying structure of the data, so you want to find a way to visualize this in a way that’s more meaningful.
Venn Diagrams with D3.js
A couple of my goals for this year are to learn both Javascript and D3.js. Its gotten to the point where its embarrassing that I don’t know Javascript, and I want to learn D3 since I keep on seeing so many beautiful looking visualizations being made with it. To get started with this, I thought I’d try use D3 to create the simplest possible visualization I could think of - the Venn diagram.
An example of this code in action is below. You can set the sizes of each set, and the sizes of the set intersections - and the code will dynamically compute the best position for each set, and display it with D3:
Python, Catastrophic Regular Expressions and the GIL
“Some people, when confronted with a problem, think ‘I know, I’ll use regular expressions.’ Now they have two problems.” Jamie Zawinski
The other day at work one of our python processes stopped responding. It was on one of our servers that was responsible for fetching and analyzing the web pages that we might recommend to people.
By the time I got around to debugging this problem, the last log message was over 20 minutes old - and the server had been maxed out at 100% CPU for the whole time. And while it wasn’t dead, it wasn’t responding to any requests, or even sending out any heartbeats. Even worse, in the meantime this problem had repeated itself on another server. Our whole ability to ingest new web pages looked to be going down one server at a time.